6th International Conference Energy & Meteorology: Abstract Submission
Towards a global dynamic wind atlas: assessing the quality of MERRA-2 and ERA5 reanalysis for wind power simulation without and with bias-correcting using the Global Wind Atlas (655)
Objective and Background
Recently modelling of renewable power has become an important research topic, in particular for assessing climate change mitigation scenarios. Time-series of varying generation of wind and solar power are of high importance to understand production variability and consequently, the necessary setup of the energy system to integrate variable renewables. As historical data sets of observed renewable power generation are temporally and spatially limited, simulation from climate data is a feasible alternative, in particular, if data should be available globally. We therefore simulate wind power generation from reanalysis data and compare different wind speed data sources for several countries, distributed over the whole world, to test how different reanalysis products perform and if additional bias correction improves results.
Data and Method
In this work, National Aeronautics and Space Administration’s (NASA) Modern-Era Retrospective analysis for Research and Applications, Version 2 (MERRA-2 [1]) as well as the European Centre for Medium-Range Weather Forecasts’ (ECMWF) ERA5 [2] reanalysis wind speed data in combination with information about installed wind parks are applied to simulate wind power generation in several countries, spread over the whole globe. As reanalysis wind speeds are known to be subject to bias, some form of bias correction is recommended [3]. We therefore use the Global Wind Atlas (GWA [4]) from the Technical University of Denmark (DTU) for mean wind speed bias correction. The GWA provides spatially highly resolved (1km) means of wind speeds globally. The simulated time series are subsequently compared to nationally aggregated historical wind power generation to evaluate which simulation methods and data sources are most qualified.
Principal Findings
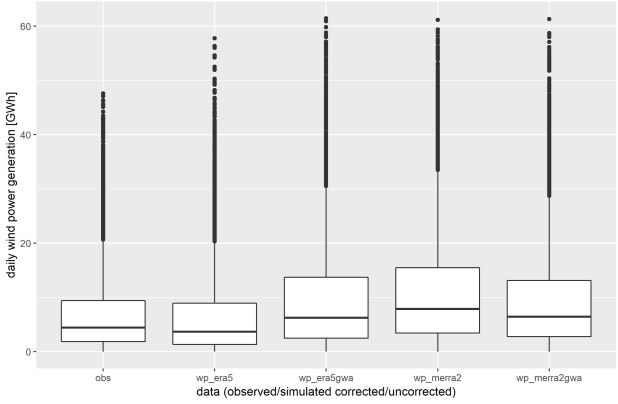
First results show clearly that ERA5 delivers better results compared to MERRA-2. This can be expected, as ERA5 has a higher spatial resolution. Yet. the GWA improved results only for MERRA-2, while correcting ERA5 decreased the fit compared to an analysis with bias correction. As an example of our outcomes, see the observed and simulated daily wind power generation in Austria shown in Figure 1. Regional differences, however, still have to be analysed in detail.

Figure 1: Daily wind power generation, comparison of historical generation (obs) and simulated time series based on ERA5 (wp_era5) and MERRA-2 (wp_merra2) without and with GWA bias correction (gwa)
Conclusion
Our first preliminary results show that bias correction improves results of wind power simulation from MERRA-2, but does not for ERA5, which has a higher native resolution. These preliminary results, however, have to be assessed in detail for all global case study regions.
- [1] NASA, „Modern-Era Retrospective analysis for Research and Applications, Version 2,“ 24 12 2015. [Online]. Available: https://gmao.gsfc.nasa.gov/reanalysis/MERRA-2/.
- [2] Copernicus Climate Change Service (C3S), „ERA5: Fifth generation of ECMWF atmospheric reanalyses of the global climate.,“ Copernicus Climate Change Service Climate Data Store (CDS), 2018.
- [3] F. Monforti and I. González-Aparicio, “Comparing the impact of uncertainties on technical and meteorological parameters in wind power time series modelling in the European Union,” Applied Energy, pp. 439-450, 04 Sept 2017.
- [4] International Renewable Energy Agency, „Map: DTU Global Wind Atlas 1 km resolution,“ Danmarks Tekniske Universitet, 7 February 2018. [Online]. Available: https://irena.masdar.ac.ae/gallery/#map/103. [Access 30 July 2018].